Waste Management Policies
Assessment of Waste-related Impacts
Waste generated by Nam Liong Global’s operations comprises domestic waste (including waste generated by employees’ daily routine and production activities), primary business waste such as waste wood (pallets) and mixtures thereof, waste fibers and cotton (fabric) mixtures, non-hazardous dust and mixtures thereof, waste plastic mixtures, waste rubber mixtures, and organic sludges. Previously, except for organic sludge being processed through thermal treatment (incineration not included), these wastes are all externally transported to incinerators or landfills for disposal, which subsequently increases the environmental burdens.
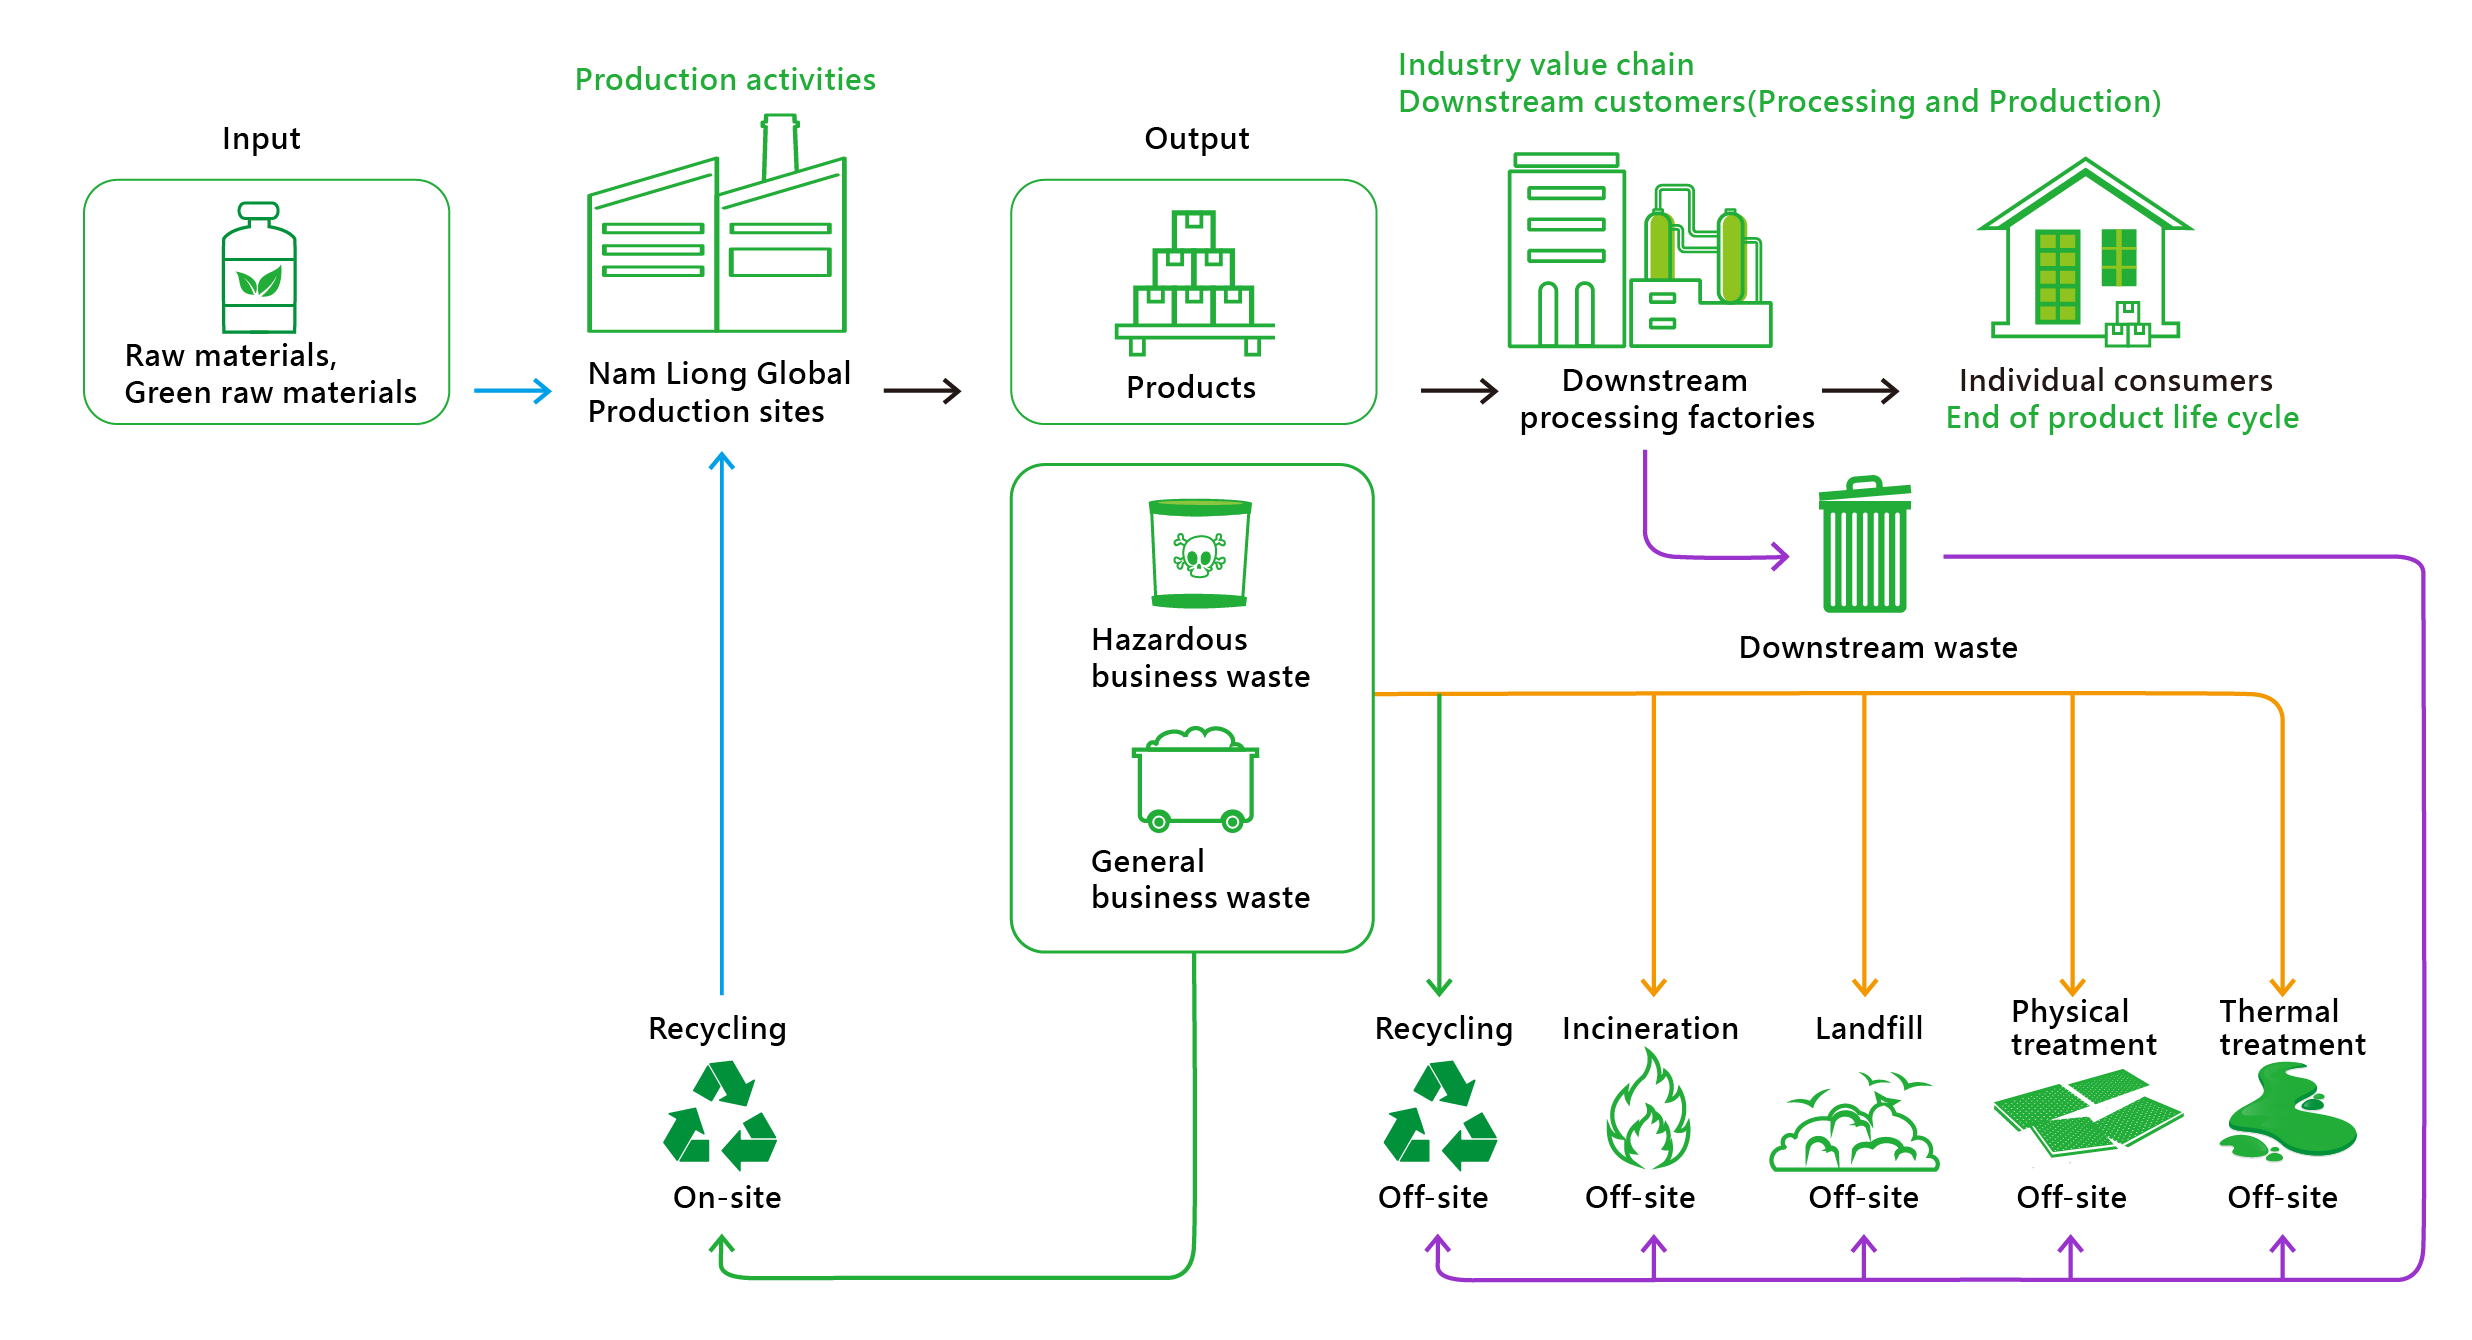
Recognizing that these business waste still holds other reusable values, following regulations outlined in the Management Measures for Reusing Business Waste announced by the Ministry of Economic Affairs, Nam Liong Global outsources a significant portion of waste plastics and rubbers to relevant processing plants for pyrolysis oil refining. In addition, solvent recovery equipment has been installed across all facilities to extract solvents from adhesive residues generated during adhesive bonding and coating processes. The recovered solvents are subsequently reused in cleaning operations, thereby advancing the goal of a circular economy. The Waste Flow Diagram (WFD) for production facilities at Nam Liong Global is shown below:
Disposal, Transfer, and Reuse of Business Waste
In 2024, reused business waste amounted to 382.714 metric tons, representing 61.87% of the total business waste generated for the year. Of this, hazardous business waste accounted for 0.17%, and non-hazardous business waste accounted for 61.70%. The recycling rate increased by 5.9% compared with the 55.94% recycling rate recorded in 2023. The primary types of reused business waste were waste rubber and organic solvents. The reuse methods implemented include:
1 |
Sending produced waste plastics to a physical treatment facility for crushing and pelleting before being delivered to the final treatment facility for use as auxiliary fuel in cogeneration boilers or adding it into rubber production as materials after processing into pellets at other treatment facilities. |
2 |
Reusing organic solvents within the facilities, such as wiping machineries. |
Direct Disposal of Business Waste
Business waste subjected to direct disposal are disposed of through physical treatment, incineration, and thermal treatment. All waste transfers are managed by authorized contractors who are responsible for the collection and incineration of waste, ensuring its proper disposal and treatment.
Waste Management Analysis Table (Unit: Metric Tons)
| Waste Category (Unit: Metric Tons) |
Nanliang International | ||||||||||||||
|---|---|---|---|---|---|---|---|---|---|---|---|---|---|---|---|
| Headquarters | Tainan Plant | Caosong Plant | Ren’ai Plant | 2023 Total | 2023 Share % | 2024 Total | 2024 Share % | ||||||||
| Main Category | Subcategory | — | Treatment Method | 2023 | 2024 | 2023 | 2024 | 2023 | 2024 | 2023 | 2024 | Total | Share % | Total | Share % |
| Preparation for Reuse and Recycling | Hazardous Industrial Waste | On-site | — | — | — | 0.508 | 1.06 | — | — | — | — | 0.508 | 0.062 | 1.06 | 0.171 |
| Off-site | — | — | — | — | — | — | — | — | — | — | — | — | — | ||
| General Industrial Waste | On-site | — | — | — | 0.3 | 0.42 | — | — | — | — | 0.3 | 0.037 | 0.42 | 0.068 | |
| Off-site | — | — | — | 433.462 | 351.584 | 22.09 | 29.65 | — | — | 455.552 | 55.845 | 381.234 | 61.631 | ||
| Not Prepared for Reuse or Recycling | Hazardous Industrial Waste | Off-site | Incineration | — | — | — | — | — | — | — | — | — | — | — | — |
| Thermal Treatment | — | — | — | — | — | — | — | — | — | — | — | — | |||
| Physical | — | — | — | — | — | — | — | — | — | — | — | — | |||
| General Industrial Waste | Off-site | Incineration | 2.086 | 2.444 | 118.04 | 105.05 | 60.08 | 58.6 | 14.734 | 17.743 | 194.94 | 23.897 | 183.837 | 29.72 | |
| Thermal Treatment | — | — | 120.56 | 48.47 | — | — | — | — | 120.56 | 14.779 | 48.47 | 7.836 | |||
| Physical | — | — | 43.89 | 3.55 | — | — | — | — | 43.89 | 5.38 | 3.55 | 0.574 | |||
| Total Waste Volume | 2.086 | 2.444 | 716.76 | 510.134 | 82.17 | 88.25 | 14.734 | 17.743 | 815.75 | 100 | 618.571 | 100 | |||